
By Michael H. Russo | July 2026
The energy spent debating what the Federal Reserve is going to do is better focused on what they can do. Whether they will cut rates, raise rates, by how much and when, hides the more consequential question of how the U.S. government intends to finance itself — and the answer, assembled piece by piece over the past twelve months, is hiding in plain sight.
Begin with the arithmetic that forces the issue. The federal government paid $970 billion in interest in 2025; the figure crosses $1 trillion this fiscal year, making debt service the second-largest item in the federal budget — larger than defense, behind only Social Security.1 The Congressional Budget Office projects it will reach $2.1 trillion a year within a decade.2 Every percentage point of interest rates now moves the budget more than most spending programs do.
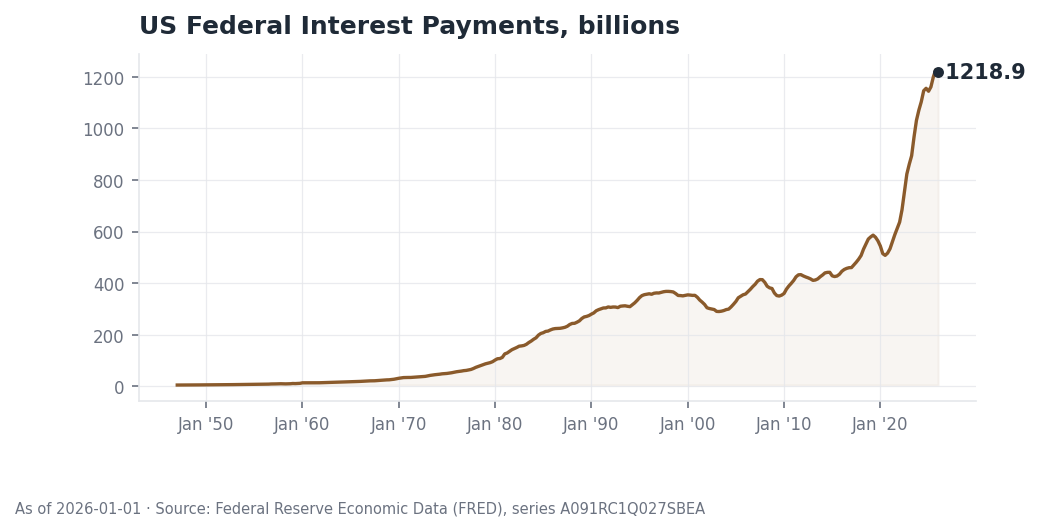
Net interest on the federal debt has crossed the trillion-dollar-a-year mark — the second-largest item in the federal budget.3
This creates a conflict of objectives that cannot be resolved by speeches. The administration needs interest rates low, because debt service at higher rates becomes untenable. The Federal Reserve needs inflation low — it is running above 4%4 — which argues against cutting. Three textbook exits exist from such a position, and all are painful: default on the debt, which is unthinkable; inflate it away through renewed quantitative easing, which is politically toxic; or let rates rise and accept the recession that follows.
There is, however, a fourth path — one that requires no announcement and no vote of the Federal Open Market Committee: arrange for balance sheets, other than the Fed’s, to absorb the Treasury supply. The evidence of the past year suggests this is the path already chosen.
Channel One: The Banks
In November 2025, federal banking regulators finalized a change to the enhanced supplementary leverage ratio — the rule that had capped how large a balance sheet the biggest U.S. banks could carry regardless of how safe its contents were.5 The recalibration, effective April 2026, lowers the requirement from a flat 5% to a range of 3.5–4.25%, and by the agencies’ own arithmetic it opens roughly $3 trillion of additional capacity for bank subsidiaries to hold Treasuries and reserves — about 9% of the entire marketable debt.6 The stated rationale is Treasury-market intermediation. The practical effect is that the banking system can now absorb years of deficit issuance that would previously have needed other buyers.
Channel Two: The Stablecoins
The second channel did not exist as a regulated market two years ago. The GENIUS Act, signed in July 2025, gave dollar stablecoins a federal charter and — the detail that matters here — requires 100% of their reserves to sit in cash and Treasury bills of under 93 days’ maturity, i.e. no fractional reserves.7 Growth in stablecoins is therefore, by statute, growth in T-bill demand. The sector already holds roughly $300 billion of Treasury exposure, and the largest issuer alone holds more U.S. government debt than most countries, placing it among the twenty largest holders in the world.7 Standard Chartered projects $0.8–1 trillion of fresh T-bill demand from stablecoin growth by the end of 2028.8 Congress has, in effect, chartered a new class of buyer whose deposits must flow into the government’s shortest-dated paper.
This Has Been Done Before
The playbook has a name and a track record. U.S. debt fell from 106% of GDP in 1946 to 23% by 1974 — a decline usually credited to economic growth. A study by Acalin and Ball reconstructs that history and finds otherwise: strip out the era’s pegged interest rates and surprise inflation — financial repression, in the literature’s plain term — and the ratio would have fallen only to 74%.9 The debt was not outgrown. It was quietly transferred, through years of negative real returns, from the government to whoever held its bonds.
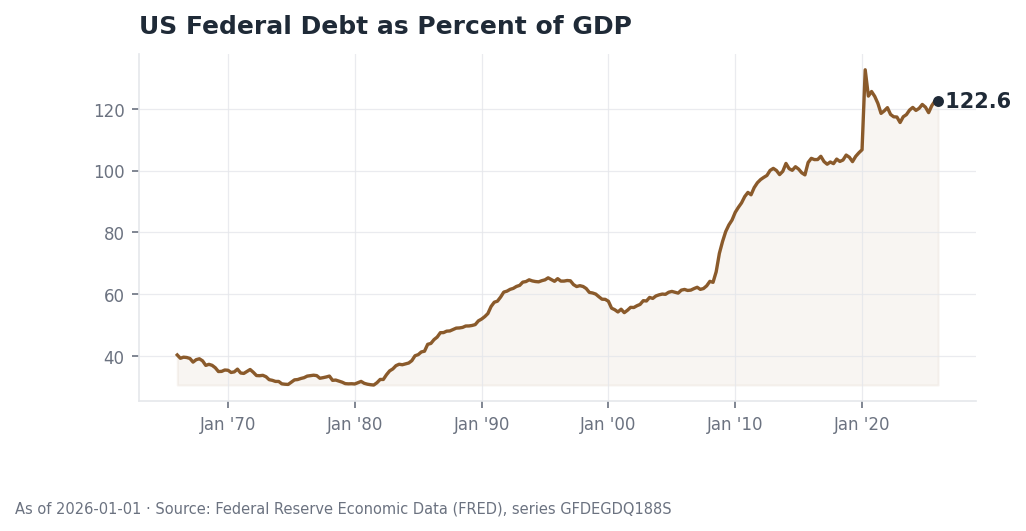
Federal debt has returned to the neighborhood of its World War II peak, of 119, relative to the economy.10
Who Pays
A reasonable question follows: if new buyers keep rates down, is that not good for markets and borrowers alike? It is — for the borrower. The bill goes to the holder. When yields are held below inflation, the real value of the debt erodes, and that erosion is precisely the saver’s loss: the postwar episode delivered deeply negative real returns on government securities for years at a stretch.9 A policy that suppresses the yield on the “risk-free” asset does not eliminate the cost of the debt. It reassigns it — from the taxpayer, visibly, to the bondholder, invisibly.
The Ceiling on the Strategy
Financial repression has one structural requirement: lenders who stay. In the 1940s and 1950s, capital controls and regulated deposit rates left American savers little choice but to hold the paper. Today’s marginal holders — foreign central banks — face no such constraint, and their behavior suggests they know the playbook too. The dollar’s share of allocated global reserves has slid from 71% at its 2001 peak to roughly 55%.11 Central banks have been buying gold at more than a thousand tonnes a year, and China has cut its Treasury holdings from $1.3 trillion to under $800 billion.11 In the World Gold Council’s 2026 survey, nearly three-quarters of central banks said they expect the dollar’s share of global reserves to keep falling over the next five years.12
This is a more surreptitious form of Quantitative Easing. Financing the deficit on other people’s balance sheets, however, still works only for as long as the world is content to hold the currency those balance sheets are denominated in. The machinery for this is built and running. Its ceiling is the dollar’s standing itself.
Sources
1 Peter G. Peterson Foundation, “Monthly Interest Tracker” — $970 billion in interest in 2025; crossing $1 trillion in FY2026; second-largest federal spending category. https://www.pgpf.org/programs-and-projects/fiscal-policy/monthly-interest-tracker-national-debt/
2 Congressional Budget Office, “The Budget and Economic Outlook: 2026 to 2036” — net interest rising from $1.0 trillion in 2026 to $2.1 trillion in 2036. https://www.cbo.gov/publication/62105
3 Federal Reserve Economic Data (FRED), series A091RC1Q027SBEA (as of 2026-01-01) — https://fred.stlouisfed.org/series/A091RC1Q027SBEA
4 CNBC, “Trump eases pressure on Fed Chairman Kevin Warsh as inflation tops 4%,” June 26, 2026. https://www.cnbc.com/2026/06/26/trump-warsh-fed-rate-cuts-inflation.html
5 Board of Governors of the Federal Reserve System, “Agencies issue final rule to modify certain regulatory capital standards,” November 25, 2025. https://www.federalreserve.gov/newsevents/pressreleases/bcreg20251125b.htm
6 ING Think, “How a change in the rules will allow big US banks to hold more Treasuries” — approximately $3 trillion in additional Treasury/reserve capacity, roughly 9% of marketable debt. https://think.ing.com/articles/how-a-change-in-the-rules-will-allow-big-us-banks-to-hold-more-treasuries/
7 Spark Research, “Inside Stablecoin Reserves: How $300 Billion in T-Bills Backs Digital Dollars” — GENIUS Act reserve requirements (cash and T-bills under 93 days); ~$300 billion sector Treasury exposure; largest issuer among the twenty largest holders of U.S. government debt. https://www.spark.money/research/stablecoin-treasury-bill-reserve-mechanics
8 The Block, “Stablecoins could drive $1 trillion in T-bill demand, giving Treasury room to shift issuance: Standard Chartered,” February 2026. https://www.theblock.co/post/390783/stablecoins-could-drive-1-trillion-in-t-bill-demand-giving-treasury-room-to-shift-issuance-standard-chartered
9 Julien Acalin and Laurence M. Ball, “Did the U.S. Really Grow Out of Its World War II Debt?,” NBER Working Paper 31577, August 2023 — debt/GDP 106% (1946) to 23% (1974); counterfactual without rate distortions and surprise inflation: 74%. https://www.nber.org/system/files/working_papers/w31577/w31577.pdf
10 Federal Reserve Economic Data (FRED), series GFDEGDQ188S (as of 2026-01-01) — https://fred.stlouisfed.org/series/GFDEGDQ188S
11 Atlantic Council, “Going for gold: Does the dollar’s declining share in global reserves matter?” — dollar share of allocated reserves 54.8% versus 71% peak in 2001; central-bank gold purchases above 1,000 tonnes per year; China’s Treasury holdings reduced from $1.3 trillion to $780 billion. https://www.atlanticcouncil.org/blogs/econographics/going-for-gold-does-the-dollars-declining-share-in-global-reserves-matter/
12 World Gold Council, “Central Bank Gold Reserves Survey 2026” — 74% of central banks expect moderately or significantly lower U.S. dollar holdings within global reserves over the next five years. https://www.gold.org/goldhub/research/central-bank-gold-reserves-survey-2026
Important Disclosures
Argos Wealth Advisors, LLC is an SEC-registered investment adviser; registration does not imply a certain level of skill or training. This commentary is for informational purposes only, reflects opinions as of the date of publication, and is not investment, legal, or tax advice, nor an offer or solicitation to buy or sell any security. Nothing herein is a recommendation to buy, sell or hold any security or to adopt any investment strategy. All investing involves risk, including the possible loss of principal; past performance is not indicative of future results, and no assurance can be given that any investment objective will be achieved. Statements regarding future economic, fiscal or market conditions are forward-looking, are based on assumptions that may prove incorrect, and are subject to change without notice; actual results may differ materially. Yields, index levels and other market figures are sourced from public market data and third-party sources believed to be reliable but not independently verified, and are provided for context only. Indices are unmanaged, do not reflect the deduction of advisory fees, expenses or transaction costs, may not reflect the risk profile of any Argos portfolio, and it is not possible to invest directly in an index. References to third parties are for illustration only and do not imply any endorsement of, or affiliation with, Argos. Advisory fees and underlying fund expenses reduce returns over time. See our Form ADV Part 2A for additional information about our advisory services, fees, and conflicts of interest.
