
By Michael H. Russo | August 2026
Our Store of Value Protocol remains active. The reason is unchanged: the market is not paying investors for the risk they are being asked to carry. Total US market capitalization stands near 219% of GDP, roughly two standard deviations above its historical trend1, while the VIX, a widely used measure of stock market volatility, sits in the mid-teens2. Extreme valuations priced as if nothing can go wrong is the definition of uncompensated risk.
We believe one of those risks deserves more attention than it receives: the risk that inflation is meaningfully worse than the official statistics say. The Consumer Price Index (“CPI”) registered 3.5% in June, down from 4.2% in May, its first decline in five months3. Our concern is not with any single print. It is with the gauge itself.
Inflation, reduced to fundamentals, is aggregate demand versus aggregate supply: the number of dollars in the system chasing the actual goods and services the economy produces. Tariffs can move prices for a time. So can supply-chain disruptions and other cost-push episodes. But these are one-time adjustments to the price level, not the engine. Over any horizon that matters to a portfolio, the engine is the ratio of dollars to output.
The CPI is a lagging, heavily adjusted proxy for that engine, and the evidence suggests it is reading low. That matters because every real return, every real yield, and every inflation-protected instrument is priced off this one number.
The Gauge Is Breaking
Before questioning the CPI’s design, consider its inputs. When field data is unavailable, US Bureau of Labor and Statistics (“BLS”) staff estimates prices; historically that covered roughly 10% of the cells in the CPI calculation. By mid-2025 the estimated share had climbed above 30%4. Nearly a third of the index that anchors Social Security adjustments, Treasury Inflation-Protected Securities (“TIPS”) payouts, and Federal Reserve policy is now modeled rather than measured, at precisely the moment precision matters most.
Built To Read Low
The design itself leans downward. Methodological changes since 1995, including the geometric-mean formula adopted in 1999, are estimated to have lowered measured CPI inflation by about 0.6 percentage points per year5. Hedonic adjustments record a more expensive product as flat or cheaper if its quality improved. Shelter, the index’s largest component, lags by construction: when market rents rise 10%, landlords raise renewing tenants’ rents by an average of just 2.1%, and the CPI samples each unit’s rent only twice a year6.
Measures built around what households must actually buy tell a different story. The Ludwig Institute’s True Living Cost index, which tracks housing, healthcare, food, transportation, and childcare, rose 106% between 2001 and 2024 against 77% for the CPI7. Essentials compounding at 3.2% per year versus a reported 2.5% is the gap between the statistic and the life it claims to describe.
The Arithmetic Underneath
At the end of the day, the engine is dollars chasing output. The M2 money stock grew 40% in the two years through April 2022, and it stands roughly 50% above its February 2020 level today8. The price level has followed: the CPI index is up 28% since January 20209, and that staircase does not step back down.
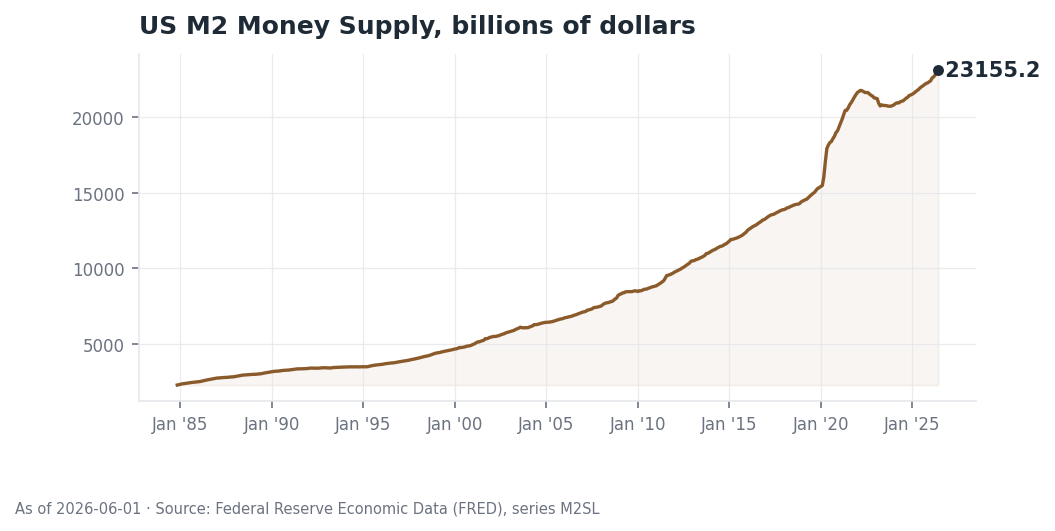
The M2 money stock rose 40% in the two years through April 2022 and remains roughly 50% above its pre-pandemic level.8
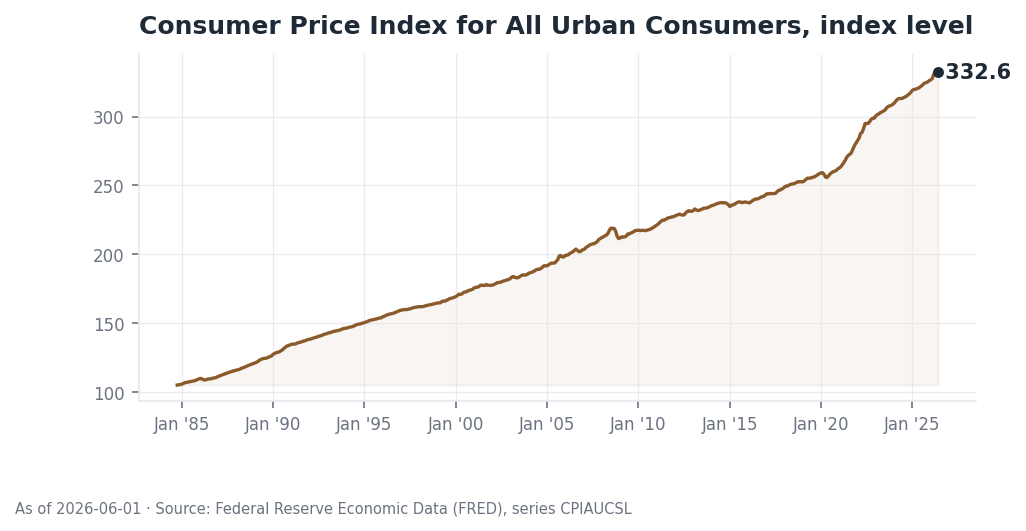
The consumer price level is up 28% since January 2020. The rate of inflation varies; the staircase does not step back down.9
Against this arithmetic, tariffs are noise. Prices of goods imported from China rose 8.5% over 2025 as tariff pass-through arrived gradually10, a real cost to households but a one-time adjustment to the level, not the engine. The engine is the ratio of dollars to goods, and the dollars are still there.
The institutions most sensitive to this arithmetic are already responding. Central banks bought a record 289 tonnes of gold in the second quarter, a 74% jump from a year earlier, with the World Gold Council reporting that gold’s role as a long-term store of value continues to feature prominently in central bank thinking11. Meanwhile the TIPS market prices future inflation near 2.3%12 while the CPI itself, flaws and all, prints 3.5%. The most informed institutions in the world are not behaving as if inflation is solved.
The Internet Precedent, And The Gap
One reason inflation stayed low for two decades deserves more credit than it gets. From the early 1970s to 1995, US productivity grew about 1.5% per year; between 1995 and 2003 that pace more than doubled as the economy absorbed information technology13. More output per hour means more goods for the dollars to chase. The internet worked quietly on the supply side of the ledger, and inflation stayed tame partly because of it.
The hope is that AI does the same, and we believe it eventually will. The question is when. Goldman Sachs research on technology adoption finds the personal computer’s productivity boom did not appear in the macro data until roughly 15 years after its 1981 commercialization; the same adoption curve puts AI’s payoff arriving around 2030 and peaking around 203414. Penn Wharton’s model reaches a similar answer: AI’s boost to productivity growth is strongest in the early 2030s, peaking at 0.2 percentage points in 203215.
The Fed, as we discussed in previous articles, is walking a tightrope. Their imperative is to keep interest rates low and therefore the debt burden tolerable. Fed Chair Warsh’s hawkish stance on inflation is jawboning intended to keep inflationary expectations low until the promise of AI’s productivity takes hold.
The gap between now and then is the risk window. Inflation likely running hotter than measured, a gauge growing less reliable, and valuations priced for calm — that combination is what the Store of Value Protocol exists for. It remains active. We will return to a full risk posture when compensation returns, whether through repriced markets or through AI delivering, at scale, the productivity it promises.
Sources
1 Current Market Valuation, “Buffett Indicator” — US market cap to GDP at 219%, about 2.1 standard deviations above the historical trend line, rated “Strongly Overvalued” (as of August 2026). https://www.currentmarketvaluation.com/models/buffett-indicator.php
2 CBOE Global Markets, “VIX Index Historical Data (VIX_History),” daily price file. Spot level in the mid-teens as of August 7, 2026. https://cdn.cboe.com/api/global/us_indices/daily_prices/VIX_History.csv
3 Trading Economics, “United States Inflation Rate” — annual CPI inflation fell to 3.5% in June 2026 from 4.2% in May, the first decline in five months (accessed August 10, 2026). https://tradingeconomics.com/united-states/inflation-cpi
4 Torsten Sløk, “The Quality of the CPI Data Continues to Deteriorate,” Apollo Academy, July 26, 2025 — BLS typically estimates about 10% of cells; the estimated share is now above 30%. https://www.apolloacademy.com/the-quality-of-the-cpi-data-continues-to-deteriorate/
5 Federal Reserve Bank of San Francisco, “A Better CPI,” FRBSF Economic Letter 1999-05, February 1999 — methodological changes since 1995, including the geometric-mean formula, estimated to reduce measured CPI inflation by 0.6 percentage points per year. https://www.frbsf.org/research-and-insights/publications/economic-letter/1999/02/a-better-cpi/
6 National Bureau of Economic Research, “Understanding the Lag Between CPI Shelter Inflation and Market Rents,” NBER Digest, October 2025 — landlords raise renewal rents 2.1% on average when market rents have risen 10%; CPI compares each unit’s rent at six-month intervals. https://www.nber.org/digest/202510/understanding-lag-between-cpi-shelter-inflation-and-market-rents
7 Eugene Ludwig, “The cost of living has risen 106% since 2001. Government inflation data doesn’t show it,” Fortune, May 6, 2026 — LISEP True Living Cost index up 106% (2001–2024) vs 77% for CPI; essentials at 3.2%/yr vs 2.5%. https://fortune.com/2026/05/06/cost-of-living-true-inflation-lisep-tlc-index-american-families/
8 Federal Reserve Economic Data (FRED), series M2SL (as of 2026-06-01) — https://fred.stlouisfed.org/series/M2SL
9 Federal Reserve Economic Data (FRED), series CPIAUCSL (as of 2026-06-01) — https://fred.stlouisfed.org/series/CPIAUCSL
10 Federal Reserve Board, “The Slow Climb: How Tariffs Gradually Raised Retail Prices in 2025,” FEDS Notes, March 5, 2026 — prices of goods imported from China up 8.5% year-over-year by December 2025; pressures developed gradually rather than as a one-time spike. https://www.federalreserve.gov/econres/notes/feds-notes/the-slow-climb-how-tariffs-gradually-raised-retail-prices-in-2025-20260305.html
11 The National, “Central banks’ gold buying hits record in Q2 as geopolitical risks persist,” July 30, 2026 — 289 tonnes in Q2 2026, a 74% year-on-year jump, per the World Gold Council. https://www.thenationalnews.com/business/markets/2026/07/30/central-banks-gold-buying-hits-record-in-q2-as-geopolitical-risks-persist/
12 Cresset Capital, “Market Update 8/5/26: An Analytical Framework for TIPS Investing,” August 5, 2026 — 5-year and 10-year TIPS breakevens converged to 2.3%; headline CPI peaked above 4% in May 2026. https://cressetcapital.com/articles/market-update/market-update-8-5-26-an-analytical-framework-for-tips-investing/
13 Federal Reserve Bank of San Francisco, “The Recent Rise and Fall of Rapid Productivity Growth,” FRBSF Economic Letter 2015-04, February 2015 — productivity rose about 1.5% per year from the early 1970s through 1995; between 1995 and 2003 the pace more than doubled. https://www.frbsf.org/research-and-insights/publications/economic-letter/2015/02/economic-growth-information-technology-factor-productivity/
14 “Goldman economist offers a reality check on AI adoption: it took 15 years for computers to really show up in the data,” Fortune, July 14, 2026 — the PC’s productivity boom appeared in macro data ~15 years after its 1981 debut; the same J-curve puts AI’s payoff around 2030, peaking around 2034. https://fortune.com/2026/07/14/goldman-ai-productivity-reality-check-worker-sabotage/
15 Penn Wharton Budget Model, “The Projected Impact of Generative AI on Future Productivity Growth,” September 8, 2025 — AI’s boost to annual productivity growth strongest in the early 2030s, peak contribution 0.2 percentage points in 2032; GDP +1.5% by 2035. https://budgetmodel.wharton.upenn.edu/p/2025-09-08-the-projected-impact-of-generative-ai-on-future-productivity-growth/
Important Disclosures
Argos Wealth Advisors, LLC is an SEC-registered investment adviser; registration does not imply a certain level of skill or training. This commentary is for informational purposes only, reflects opinions as of the date of publication, and is not investment, legal, or tax advice, nor an offer or solicitation to buy or sell any security. Nothing herein is a recommendation to buy, sell or hold any security or to adopt any investment strategy. All investing involves risk, including the possible loss of principal; past performance is not indicative of future results, and no assurance can be given that any investment objective will be achieved. Statements regarding future economic, fiscal or market conditions are forward-looking, are based on assumptions that may prove incorrect, and are subject to change without notice; actual results may differ materially. Yields, index levels and other market figures are sourced from public market data and third-party sources believed to be reliable but not independently verified, and are provided for context only. Indices are unmanaged, do not reflect the deduction of advisory fees, expenses or transaction costs, may not reflect the risk profile of any Argos portfolio, and it is not possible to invest directly in an index. References to third parties are for illustration only and do not imply any endorsement of, or affiliation with, Argos. Advisory fees and underlying fund expenses reduce returns over time. See our Form ADV Part 2A for additional information about our advisory services, fees, and conflicts of interest.
